Look at the headline number for South Boulder right now and you'd guess the neighborhood is cooling. Over the three months ending April 2026, the median sale price came in at $845,000, down 12 percent from the same stretch a year earlier. Homes took a little longer to sell too, 38 days on average compared with 35 the year before.
Now walk two blocks east across Broadway into Table Mesa, still technically part of South Boulder, and the story flips. Over the three months ending May 2026, Table Mesa South's median sale price ran $1.2 million, up 25 percent year over year, with homes moving faster than the year before, not slower.
Same season. Same broader neighborhood tag. Opposite conclusions. That gap is the thing worth understanding before you compare South Boulder to anywhere else, because the number most people quote is an average of markets that don't actually compete with each other.
The Same Three Months, Two Different Stories
Boulder as a whole was softening through the spring of 2026. The city's median sale price sat at $854,000 over the three months ending May 2026, down 14.5 percent year over year, with homes averaging 50 days on the market. Against that backdrop, South Boulder's 12 percent decline reads as unremarkable. It's tracking the city.
Table Mesa South is the outlier, and it's worth being honest about why the 25 percent jump looks so dramatic. Only 13 homes sold there in May 2026, down from 18 the year before. A sample that small can swing a median hard on the strength of one or two high-end renovations closing in the same month. The same page reported the average house price at $915,000 for the prior month, down 3.5 percent, a very different number from the $1.2 million median just described. Average and median aren't measuring the same thing, and when the pool of sales is this thin, they can tell you different stories about the same few weeks.
That's not a reason to dismiss the number. It's a reason to ask what's behind it before you build a budget around it. And what's behind it, at least in part, is structural.
Why Table Mesa and Martin Acres Don't Compete for the Same Buyer
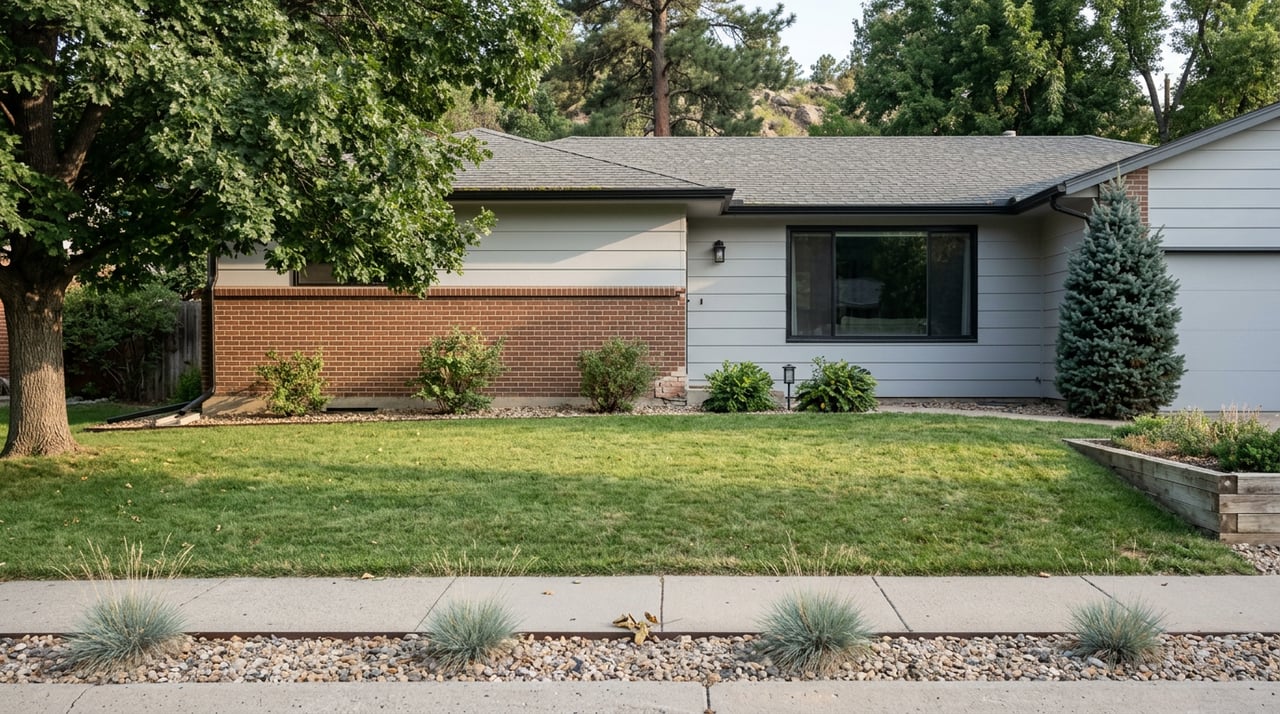
Table Mesa and Martin Acres were built in roughly the same mid-century wave, ranches and split-levels on tree-lined streets, and they sit close enough to walk between. But they answer to different constraints.
Table Mesa presses right up against Boulder's protected open space and the Blue Line, the voter-approved boundary that has limited hillside water service and development above a set elevation since 1959. That means Table Mesa's supply of buildable lots is effectively fixed. Nobody is platting a new subdivision into the foothills behind it. Homes here also sit close to trailheads for Bear Creek and the Mesa Trail system, and to neighborhood anchors like Harlow Platts Park and Viele Lake, the kind of walkable amenity that shows up in what a buyer is willing to pay for a lot backing to open space versus one that doesn't.
Martin Acres sits closer to the University of Colorado and runs along Broadway, and a meaningfully larger share of its housing stock operates as rental property rather than owner-occupied. That matters for reasons beyond who's living there day to day. When an appraiser or a lender pulls comparable sales for a purchase loan, a market with more non-owner-occupied turnover produces a different comp pool, often at different price points, than a market where most transactions are owner to owner. A recent roundup of Boulder's more attainable neighborhoods for 2026 named Martin Acres specifically as a draw for university employees, healthcare workers, and young families looking for a true Boulder address without paying what the city's more land-constrained pockets command.
Put plainly: Table Mesa's ceiling is set by scarcity of land. Martin Acres' ceiling is set by a wider, more transactional buyer pool. Averaging them into one "South Boulder" number tells you something true about the aggregate and nothing useful about either individual street.
Here's how the three views compare over the same reporting window:
| South Boulder (aggregate) | Table Mesa South | |
|---|---|---|
| Median sale price | $845,000 (3 months ending Apr. 2026) | $1.2 million (3 months ending May 2026) |
| Year-over-year change | down 12.0% | up 25.0% |
| Average days on market | 38 (vs. 35 a year earlier) | 32 (vs. 38 a year earlier) |
| Monthly closed sales | 47 in April 2026 (vs. 43 prior year) | 13 in May 2026 (vs. 18 prior year) |
The aggregate is decelerating on every measure. The sub-market inside it is accelerating on every measure. Both are true. Neither is the whole picture.
What This Means If You're Comparing on Paper
If you're sitting somewhere else in the country scrolling listings tagged "South Boulder," a few things follow from the numbers above.
First, ask which streets a listing actually sits on before you anchor on a neighborhood-wide median. A house described as South Boulder could be a Table Mesa property backing to open space or a Martin Acres ranch three blocks from Broadway, and those two houses are not drawing from the same buyer pool or the same financing comps.
Second, treat any month-over-month swing in a small submarket with some skepticism. Thirteen sales is not a trend, it's a snapshot that one large closing can distort. If your lender's appraisal comes back referencing a handful of nearby sales, ask how many transactions actually informed that number and over what window.
Third, factor in what proximity is actually buying you. A premium tied to trailhead access or backing to open space in Table Mesa reflects a genuinely fixed supply of that kind of lot. A discount in a rental-heavy stretch of Martin Acres reflects a different, more liquid comp pool, not necessarily a lesser home. Neither is automatically the smarter buy. They're different products serving different priorities, from a five-minute walk to Table Mesa Shopping Center or Creekside Elementary to a quieter, land-locked street with a longer commute to campus.
A Few Questions Worth Asking Before You Compare
Is South Boulder currently a buyer's market or a seller's market? The aggregate data through spring 2026 leans toward buyers, with prices down and days on market up compared with the year before. But that read doesn't hold in every pocket, as Table Mesa's faster sales and rising median show. Ask for submarket-specific numbers, not the neighborhood-wide figure, before you decide how much negotiating room you actually have.
Why did Table Mesa's median jump 25 percent in a year if Boulder overall is cooling? Part of it is real: fixed land supply against the Blue Line and open space boundary keeps a lid on how much new inventory can ever enter that specific pocket. Part of it is statistical: with only 13 sales in the month reported, a couple of high-value renovations closing together can move the median more than the underlying market actually shifted.
Is Martin Acres a worse investment than Table Mesa? Not necessarily. It's a different market with a different buyer pool and a different set of comps. For a buyer prioritizing a Boulder address at a more attainable price point, proximity to campus and transit, Martin Acres solves a real problem. For a buyer prioritizing trail access and long-term land scarcity, Table Mesa solves a different one. The mistake is comparing the two on a single median that averages them together.
If you're weighing a move into South Boulder and want the block-by-block read rather than the headline number, The Patrick Dolan Team has spent decades tracking exactly these distinctions across Boulder County. What's my home worth?